A one-page summary for how to use the Chucktown Floods website.
The Home Page:
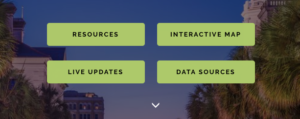
The four boxes in the middle of the Home Page are popular categories of information available on the website. If you click on the “Interactive Map” button you will be linked to the maps page. Additionally, there is a small downward-facing arrow located under the four boxes. If you click on this button, you will see more information below.
The Navigation Bar:
In navigation bar is located at the top of the homepage. It is a list of links which provides an easy way to navigate the website. At the right of the navigation bar is a small magnifying glass icon for the general search feature and a small question mark icon for helpful tips on how to use the website.

About Links:
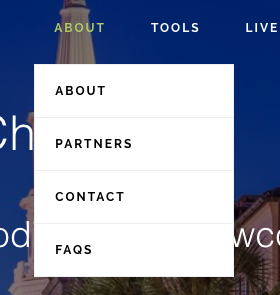
Another option of the “navbar” is the “About” links list. This drop-down list shows links to the About Us, About Our Partners, Contact Us, and Frequently Asked Questions and How-To pages.
Tools Links:
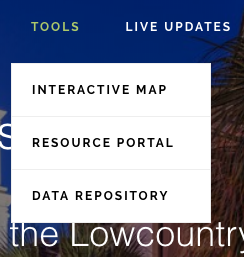
The “Tools” links is another drop-down option located in the navigation bar. It links to the information tools of the website such as the Resilience Portal, the Interactive Map, and the Data Repository.
Live Updates Page:
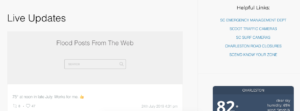
The “Live Updates” link is another option located in the navigation bar. On the Live Updates page, you can search various social media sources for relevant news about the weather and flooding. In the right margin of the Live Updates page, you will see useful weather, tides, and flooding widgets. These widgets provide real-time information about flooding and weather news.
Resources Page:
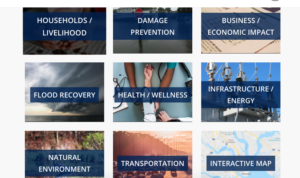
The nine boxes in the middle of the Resources Portal are categorized by subject matter to help users find relevant information. You can click on any one of them and see all of the available resources in that category.
The Search Box:
If you are looking for a specific Resource or topic you may also use our search box located in the top left of this page. Just type in the title or the subject of the resource and press enter.

Advanced Search:
In the Resources Portal, we have included an Advanced Search option. You can access this by clicking on the green “Advanced Search” button located to the right of the search box. After clicking on this button you will see an advanced search interface with filter boxes in the left margin. Check any of these filter boxes to limit the search results displayed.

The Data Repository Page:
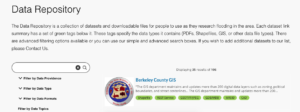
The Data Repository is a section of the website which is dedicated to data-rich tools and links. You can use the filter system located in the left margin to find specific types of data. These filters will also work with the search box located above the filters.
The Interactive Map Page:
The Search Box:
You can use the search box located on the left of the interactive map window to find specific addresses or locations.

The Layers List:
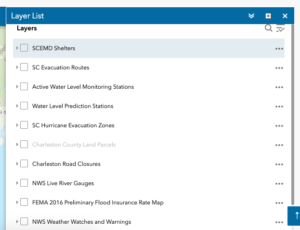
Located on the right side of the interactive map window you will find a Layers List. The layers that you check from this list will be displayed over the base map. If layers in the list are greyed out or disappear from the map, that means you can’t see it at the current scale. Just click on the 3 dots next to the layer name and select “Zoom To” to get back to the appropriate scale for viewing. The 3 dot menu will also allow you to change the layer’s transparency and view the original data source by clicking “Description”.
The Legend:
Some of the layers are color-coded. To understand what each color means you need to open the “Legend” window. To do this, click on the Legend icon in the top right margin of the interactive map. This will open up a color defined legend for the map overlay.

Instructional Webinar
ChucktownFloods Webinar from CRN on Vimeo.