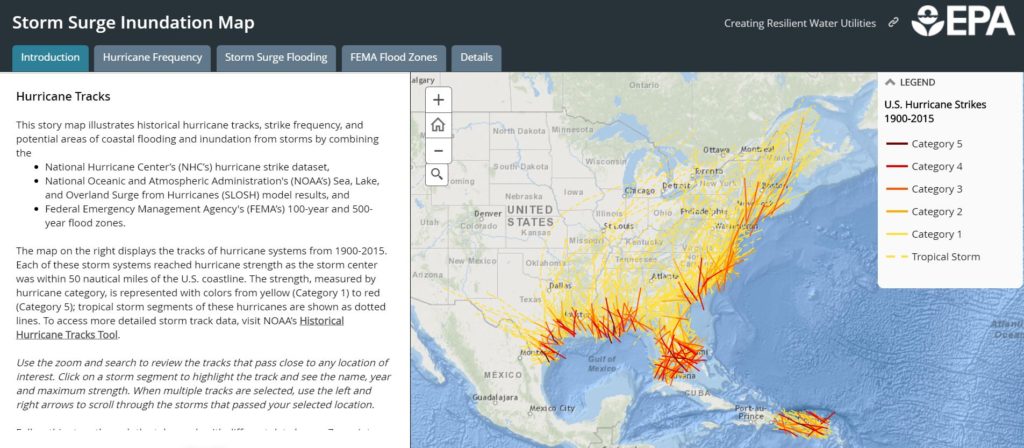
This story map illustrates historical hurricane tracks, strike frequency, and potential areas of coastal flooding and inundation from storms. It combines the National Hurricane Center’s (NHC’s) hurricane strike dataset, National Oceanic and Atmospheric Administration’s (NOAA’s) Sea, Lake, and Overland Surge from Hurricanes (SLOSH) model results, and Federal Emergency Management Agency’s (FEMA’s) 100-year and 500-year flood zones.
